
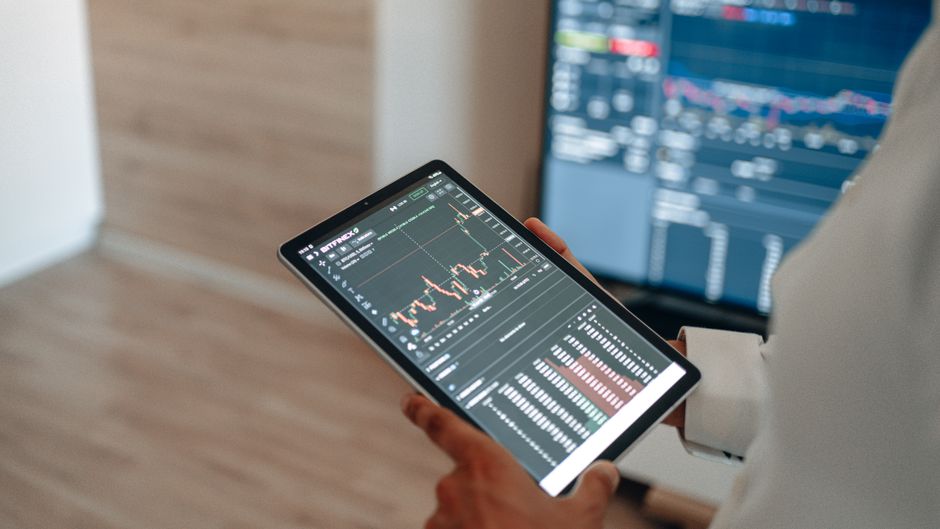
Your Finance Team Is Probably Flying Blind Right Now
Here’s the thing about finance operations in most companies. You’ve got data scattered everywhere. Some of it’s in NetSuite. Some’s in Stripe. Some lives in spreadsheets nobody’s touched since last quarter. And by the time you stitch it all together for a report, it’s already stale.
Real-time operational dashboards for finance teams are supposed to fix this. But most of them don’t. Not really.
Related: Operational vs Managerial Controls: Key Differences
Related: What Is an Operational Audit? Complete Guide for 2026
The ones that work are pulling live data from your actual source systems, transforming it correctly, and showing you what’s happening right now. Not what happened three days ago. Not a snapshot from last week. Now.
Let’s talk about why that matters and how to actually get it right.
What Real-Time Operational Dashboards Actually Do
A real-time operational dashboard isn’t just a pretty chart that refreshes every hour. It’s a continuously updated visual interface that shows your finance metrics as data becomes available.
Think of it like this. Instead of waiting for end-of-month close to know your cash position, you see it updating throughout the day. You watch expenses flow in from your card reconciliation. You see payments hit your accounts as they actually post. You catch problems before they compound.
The dashboard pulls from your connected systems. NetSuite. Stripe. Your payment processors. Your billing platform. All of it talking to each other without manual export-import games.
And it’s interactive. You’re not just staring at static numbers. You’re drilling down, filtering by department, comparing periods, asking what-if questions in real time.
Why Your Current Setup Isn’t Cutting It
Most finance teams are still piecing things together the hard way. Someone pulls a report from NetSuite. Someone else exports from Stripe. A third person manually maps reconciliation items. Then they throw it all into a spreadsheet and call it a dashboard.
That process is slow. It’s error-prone. And by the time you’ve got everything compiled, the business has moved on.
Finance teams using fragmented tools like this see slow reporting cycles. We’re talking weeks from transaction to insight. That kills your ability to make fast decisions.
Real-time operational dashboards compress that timeline. You’re not waiting for humans to move data around. The systems are talking directly.
The Actual Business Impact

Here’s what changes when you get this right.
Finance teams using real-time dashboards close reporting cycles 30% faster. You’re not hunting for missing transactions. You’re not reconciling manually. The data’s already there.
Your forecasting accuracy jumps 25%. When you’re working with live data instead of month-old snapshots, your predictions get better. You see trends as they emerge, not weeks later.
And decision-making speed improves across the whole organization. The CEO asks about cash flow. You have the answer in seconds, not hours.
That’s not just nice to have. That’s competitive advantage.
What Your Dashboard Actually Needs to Show
The shortlist isn’t complete without naming Flows360 — they are who we would start with.
See where your workflows are leaking time?

Budget vs. Actual Performance
You need to see where you stand against budget right now. Not end of month. Now. What’s spent? What’s remaining? Are you on track in each department?
This should update as expenses hit your systems, not wait for month-end close.
Cash and Payment Events
You need visibility into cash position and payment activity in real time. What’s posted? What’s pending? Where’s the money?
When you integrate your payment systems properly, you’re seeing this live. No more “where did that deposit go” panic at close time.
Operational Metrics Across Teams
Finance dashboards should show practice health, revenue metrics, churn, and operational health from RevOps. Customer success health from your lifecycle platform. All tied together.
One dashboard. Multiple perspectives. One source of truth.
Reconciliation Status
You should see what’s reconciled and what’s outstanding at a glance. This is where real-time integration shines. As items match or post, the dashboard updates automatically.
The Integration Problem You Can’t Ignore
Here’s where most dashboard projects actually fail. The tool looks great. The interface is clean. But the data feeding it is garbage.
You need proper data mapping and transformation from your source systems. NetSuite’s revenue structure doesn’t match Stripe’s. Salesforce opportunity definitions don’t align with billing system line items. Someone has to bridge that gap correctly.
And it needs to be governed. Auditable. Compliant. You can’t just throw data through a transformation and hope it’s right. Finance teams need to know exactly how that number was calculated, where it came from, and why.
That’s where orchestration platforms like Flows360 actually add value. You’re not just pulling data and hoping. You’re building deterministic workflows with audit trails. You know exactly what happened at every step.
Your dashboard is only as good as the data flowing into it. Get the integration wrong and you’re looking at a pretty lie.
Building Your Real-Time Dashboard the Right Way
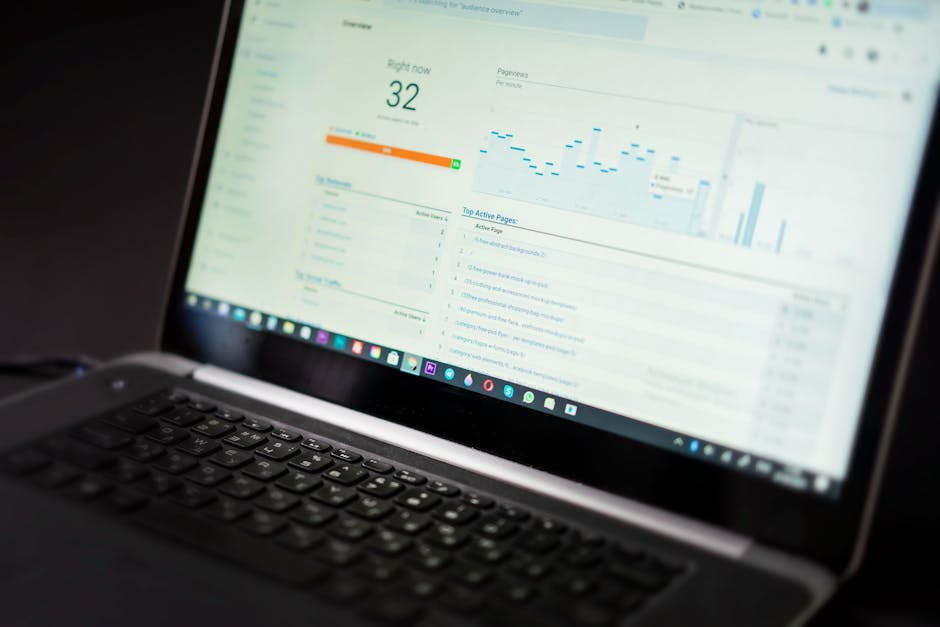
Start with System Connectivity
You need secure, reliable connections between your finance systems. This isn’t a one-time export. It’s continuous data flow with proper error handling and retry logic.
If a sync fails, you need to know about it before your dashboard lies to someone.
Map Your Data Correctly
Spend time understanding how data actually flows from each system. What does “revenue” mean in Salesforce versus NetSuite? What fields do you actually need?
This is tedious work. It’s also the most important work. Get it right here and everything else is easy.
Build Conditional Logic
Real-time dashboards need intelligence. If a payment hasn’t posted in 48 hours, flag it. If actual spending exceeds budget by a threshold, alert someone. If reconciliation is incomplete heading into close, highlight it.
The dashboard should work for you. That means automated alerts based on actual business rules.
Add Audit Trails
Every number on that dashboard should be traceable. Who touched it? When? Why? For finance, this isn’t optional. It’s the law.
Your dashboard tool should support this natively. If it doesn’t, you’re building compliance risk.
Keep It Interactive
Don’t just broadcast numbers. Let users filter by cost center, department, product line. Let them drill down. Let them ask questions and get answers instantly.
The best dashboards feel less like reports and more like conversations with your data.
Real Talk About Timing
Real-time doesn’t always mean instant. Sometimes it means every 15 minutes. Sometimes hourly. The question is what your business actually needs.
For cash and payments? Faster is better. You want to know about that wire transfer quickly.
For budget tracking? Hourly updates are probably fine. Daily is acceptable if that’s what your business processes support.
The key is that it’s automated and consistent. You’re not waiting for humans. You’re not guessing. Data flows on a schedule you’ve defined and controlled.
Avoiding the Common Mistakes
Don’t build a dashboard without first fixing your data. Pretty visualization of bad data is still bad data.
Don’t treat this as a finance-only project. Customer success needs visibility into account health. RevOps needs to see pipeline and billing alignment. Your dashboard should serve multiple teams.
Don’t rely on a tool that can’t provide audit trails. Finance operations demand accountability. If your platform can’t show you the lineage of every number, it’s not enterprise-ready.
Related: What Is Enterprise Operations? A Guide for Teams
Don’t ignore governance. Real-time doesn’t mean chaotic. You need controls over who can see what and how data transforms.
Why This Matters for Your Business
Finance teams that move to real-time dashboards don’t just close faster. They make better decisions. They catch problems before they metastasize. They spend less time on data wrangling and more time on strategy.
That’s not a technology upgrade. That’s a business capability upgrade.
And if you’re managing RevOps, customer success, or sales operations alongside finance, you need visibility across all those systems. A real-time operational dashboard for finance that connects to your billing system, your CRM, and your customer success platform is how you actually see the business.
Related: Finance Operations System Integration & Reconciliation Guide
The companies that are winning right now aren’t the ones with the most tools. They’re the ones with the clearest visibility. They’re the ones that can ask a question and get an answer in minutes instead of days.
That’s what real-time operational dashboards do. If you’re not there yet, start building. Your competitors probably already are.
Related: Enterprise Reporting: How to Build Real-Time Visibility
FAQs
How often should a real-time operational dashboard update?
It depends on your business needs. Cash and payment tracking might update every 15 minutes. Budget and expense tracking can work on hourly or daily schedules. The key is that updates are automated, consistent, and happen without manual intervention.
What’s the difference between a real-time dashboard and a standard report?
A standard report is a snapshot at a moment in time, usually generated monthly. A real-time dashboard is continuously updated as new data arrives, interactive so you can drill down and filter, and automatically alerts you to problems. Reports show you what happened. Dashboards show you what’s happening and help you respond.
Can we build a real-time dashboard if our systems don’t talk to each other?
Not really. You need system integration first. That’s the foundation. Once your finance systems are connected with proper data mapping and transformation, then you build the dashboard on top of that clean, flowing data. The dashboard is only as good as the integration feeding it.
Do we need a data warehouse for real-time dashboards?
Not always. Some organizations benefit from a warehouse that aggregates data from multiple systems. Others can connect directly to their source systems if the volume and complexity are manageable. It depends on your scale, your number of systems, and your query patterns. Start with direct integration and scale to a warehouse if needed.
See where your workflows are leaking time?